The technical analysis is the winning and best analysis on the forex market for prediction of the trading for a short time, as daily trading, trading in one week and to trading for one month period. For more than two months is a little difficult to make a clear analysis and to be successive.
The technical analysis is the best because it is possible to use for the time by 1-minute to 1-day charts and combine with the top technical indicators the data will show the best and most accurate than all other analyses. There is not a professional trader who does not use technical analysis to make forecasts and to trade. Learning the technical you are learning the main base for forex trading.
ADX Technical indicator
Welles Wilder develops the indicator Average Directional Index (ADX). The indicator shows the strength of the current trend. The indicator gives important
information for starting and existing trends on the market.
ADX fluctuates between 0 and 100. Readings above 60 are relatively rare. Low readings, below 20, indicate a weak trend and high readings, above 40, indicate a strong trend. The indicator does not grade the trend as bullish or bearish but merely assesses the strength of the current trend. A reading above 40 can indicate a strong downtrend as well as a strong uptrend.
ADX can also be used to identify potential changes in a market from trending to non-trending. When ADX begins to strengthen from below 20 and moves above 20, it is a sign that the trading range is ending and a trend could be developing. When ADX begins to weaken from above 40 and moves below 40, it is a sign that the current trend is losing strength.
With ADX come two other indicators call Positive Direction Indicator (+DI) and Negative Direction Indicator (-DI). When both lines cross it is a buy or sell signal. The +DI shows upward momentum, so when +DI moves from down and cross –DI and continue upward it is a buy signal. Otherwise the signal when –DI cross +DI is generating a sell signal.
MACD Technical Indicator
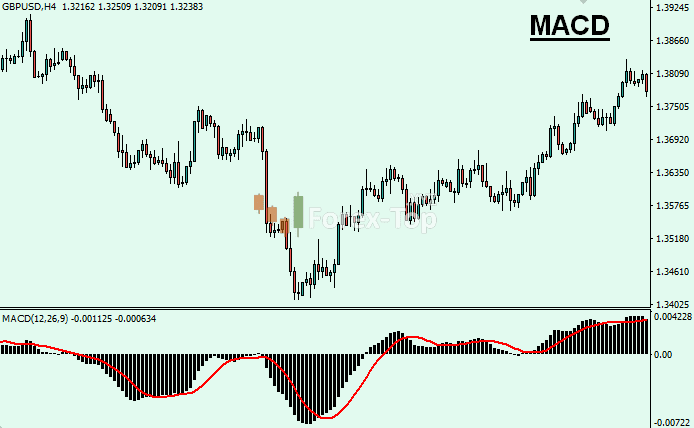
The technical Indicator MACD is one of the simplest and most useful. Our advice does not start to trade without watching MACD.
The most popular formula for the "standard" MACD is the difference between a security's 26-day and 12-day exponential moving averages. Using shorter moving averages will produce a quicker, more responsive indicator while using longer moving averages will produce a slower indicator. The 12/26 MACD is the most important and most useful by the traders. The most useful by the traders will mean that much more traders will use the same signals, so the market will move more by the way of MACD 12/26. Everyone could adjust MACD with different series to their own specific trading needed. But is better to use 12/26.
Of the two moving averages that make up MACD, the 12-day EMA is the faster and the 26-day EMA is the slower. Closing prices are used to form the moving averages. Usually, a 9-day EMA of MACD is plotted alongside to act as a trigger line. A bullish crossover occurs when MACD moves above its 9-day EMA and a bearish crossover occurs when MACD moves below its 9-day EMA.
MACD measures the difference between two moving averages. A positive MACD indicates that the 12-day EMA is trading above the 26-day EMA. A negative MACD indicates that the 12-day EMA is trading below the 26-day EMA. If MACD is positive and rising, then the gap between the 12-day EMA and the 26-day EMA is widening. This indicates that the rate-of-change of the faster moving average is higher than the rate-of-change for the slower moving average. Positive momentum is increasing and this would be considered bullish. If MACD is negative and declining further, then the negative gap between the faster-moving average and the slower moving average is expanding. Downward momentum is accelerating and this would be considered bearish. MACD centreline crosses occur when the faster-moving average crosses the slower moving average.
A more detailed analysis of the indicator using you will receive in the “Trading strategies” chapter (LINK).
Stochastic Oscillator
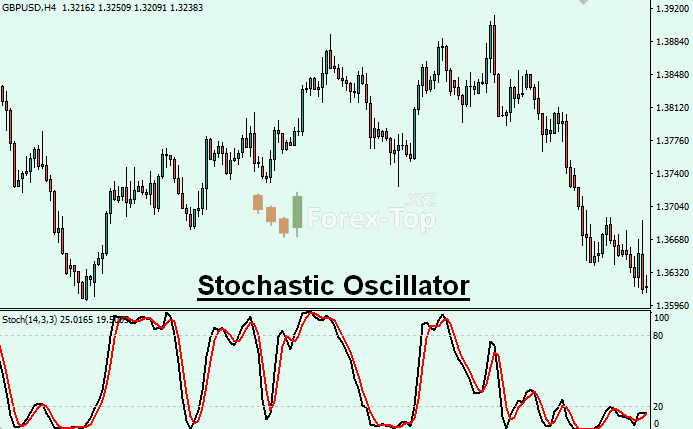
The Stochastic Oscillator is one of the best forex trading indicators. George Lane develops it in the late 1950s. It is a momentum indicator that shows the location of the current close relative to the high/low range for a set number of periods. The indicator range is from 0 to 100. Above 75 is a sell level and below 25 is a buy level.
The formula to calculate Stochastic Oscillator is the follow:
%K = 100 x {[Recent close – Lowest Low (n)]/[Highest High (n) – Lowest Low (n)]}
%D = 3 %k
n – number of periods used.
There are three types of the indicator: Full, Fast, and Slow. The indicator consists of two lines %K and %D. But it has to adjust the indicator with the needed to the individual traders. The best is to use %K 5, %D 3, Low/High, Delay 3 and for Method the best is Weight.
When both lines %K and %D cross between at levels below 25 it is a buy signal. The dashed line has to cross the mainline and remain below the mainline, then and the crossing has to be sure and viewable then is a buy signal. When the lines cross above 75 and the dashed line remains higher than the mainline it is a sell signal. Also could come and when the lines cross in the range 25 – 75 but then the signals are weak and the trading using these signals is weak.
The best signals come by the Stochastic Oscillator when has divergence. The divergence has to happen in the area of overbought or oversold. The indicator lines cross two times above 75 or below 25 and make two tops (two bottoms) as the second top is weaker than the first top (the second bottom is higher than the first bottom). Then the indicator shows divergence and that situation is a strong sell (buy) signal.
The most important using this indicator is to use the signals only when having on the chart smooth lines. Only then the signal is real. Otherwise, you will lose. More detail you will learn about it in Trading Strategies lessons (LINK).
RSI Technical Indicator
The RSI (Relative Strength Index) indicator gives information for the magnitude of gains and losses.
RSI is a very popular indicator and a very useful and popular momentum oscillator. The RSI compares the magnitude of the recent profit and recent loses and turns the information on a scale of 1 to 100. It is using different time periods to calculate the indicator.
The formula for RSI
RSI = 100 – (100/(1+RS))
Average Gains = (Total Gains/n)
Average Losses= (Total Losses/n)
First RS = (Average Gain/Average Loss)
Smooth RS =={[(previous average gain) x 13 + current gain] /14} / {[(previous average loss) x 13 + current loss]/14}
n – number of RSI periods
For a 14-period RSI, the Average Gain equals the sum total of all gains divided by 14. Even if there are only 4 gains (losses), the total of those 4 gains (losses) is divided by the total number of RSI periods in the calculation (14 in this case). The Average Loss is computed in a similar manner.
The RSI indicator shows also the oversold and overbought levels. The reading of the indicator above 70 means overbought and below 30 means oversold.
So if the signal falls below 70 it is a bearish signal, and above 30 it is a bullish signal.
The other key use of RSI comes when the indicators show divergence. The divergence is when we have two tops or two bottoms as the second is with less value. Then it is a strong entry signal. For example, if we have top of RSI at 82 and later on the technical chart come top at 74 and the new top could not keep and start downward it is a strong selling signal.
The center line for the RSI indicator is 50. The readings below 50 of the value of the indicator give a bearish tilt and above 50 bullish tilt.
Moving Average
The moving average is one of the most popular and simple indicators. By using an average of prices, moving averages smooth a data series and make it easier to spot trends.
Moving average use the average price on the forex market for an appointed period. The adjustments are simple and could be made from 1 to a few hundred. The best use of the indicator is to make two moving average indicators, the first to be for a short period of time and the second for a long period. All adjustments have to be for weight not for simple or exponential. The weight method is the best because clears the chart and have applying more weight to the recent price than to the old prices.
The traders who want to use Moving Average for daily trading are better to use about 6 and 21 for both moving average indicators on the chart. The trader’s long-term positions are better to use 60 and 200 periods.
The signals with moving average come when both lines cross for example the short period line crosses the long-period line it is a buy signal. Sell signal comes when the long period line crosses the short period line. For trading with a moving average is better to use longer stop losses than using more accurate technical indicators like MACD and Stochastic. The Moving average indicator generates and many fall signals if it is not adjusted well and if it is not watching this indicator for a different time period on the chart 5-minutes, 15-minutes, and so on.
Support / Resistance Levels
One of the most important tradings on the forex market is to have available with you the recent actual support/resistance levels.
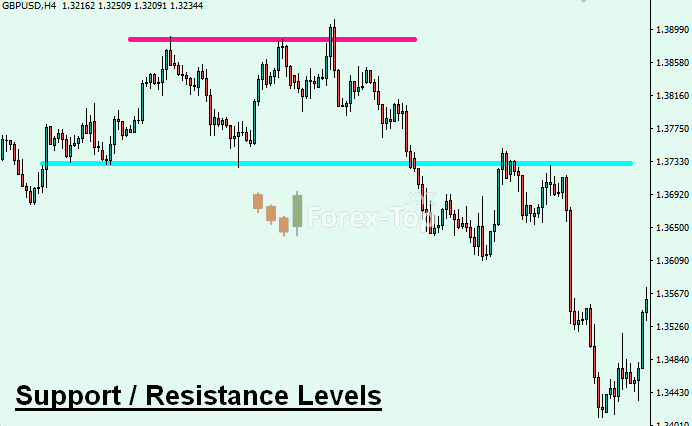
These levels are such levels, where when the trading reach one of the levels will receive support or resistance to overtaken the level and could back. The traders appoint close to the support level buy orders and sell orders close to the resistance level.
The trading could break these levels, only when having significant reasons for that. The broken of one of these levels will mean that the trading could reach the next support or resistance levels.
To appoint the support/resistance levels you can use the following two main analyses. The first is to watch on the chart the recent top or bottom. Where is the last top there is the new resistance level.
At the level of the last bottom is the support level. If the trading is moving two high by the last bottom or top, then you can use the Fibonacci levels. The Fibonacci levels will give you the resistance or supports placing the Fibo between the top and bottom or between the bottom and top.
By this way Fibonacci will give the levels of 23.6 %, 38.2%, 50.0%, 61.8% and 100.0%. More details about the use of Fibonacci levels you will learn in Trading strategies lessons.


.png)